
Ultimate Guide to Travel Graphs| Cambridge IGCSE Mathematics
[Please watch the video attached at the end of this blog for a visual explanation on the Ultimate Guide to Travel Graphs]
Travel graphs fall under the bigger topic of Algebra, but unlike the other lessons under this topic, this is really simple and easy to understand… as long as you read the question carefully and pay attention to the readings of the graphs ?!
What is a travel graph?
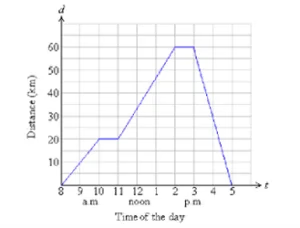
A travel graph is a line graph that tells us how much distance has been covered by the object in question within a particular time. We can use travel graphs to represent the motion of cars, people, trains, buses, etc. This means travel graphs can tell us whether an object is still (stationary), moving at a constant speed, accelerating, or decelerating. The y-axis represents the distance travelled while the x-axis shows the time it takes to travel a distance such as that.
Example 1:
James went on a cycling ride. The travel graph shows James’s distance from home on this cycle ride. Find James’s speed for the first 60 minutes.
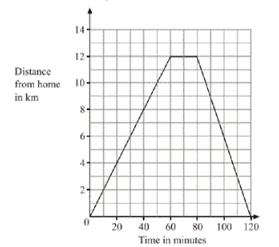
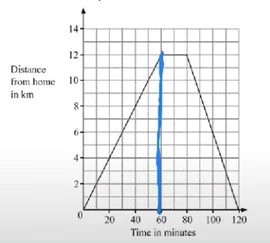
We are told that James is going on a cycling ride and that the distance he travelled is what is shown here. What is required of us is to find James’s speed for the first 60 minutes. This means you need to mark the point at 60 minutes on the x-axis as shown in the picture below.
We have learnt when learning about Speed, Time and Distance that speed = distance/ time.
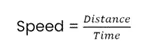
Therefore, in a distance-time graph, the slope that we see (also called the gradient) is what will give us the speed.
We can see that this particular cycle has travelled 12 km in 60 minutes.
When we substitute these values into the formula above, it would look like this:
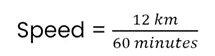
When this formula is solved, then we get James’s speed for the first 60 minutes, which is 0.2 km/min.
Example 2:
A train journey takes one hour. The diagram shows the speed-time graph for this journey. Calculate the total distance of this journey.
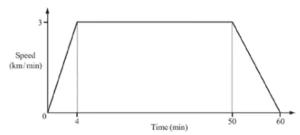
We need to be careful here because this time what we have in this question is a speed-time graph and not a distance-time graph.
In a speed-time graph, the gradient of a slope represents either acceleration or deceleration, which will be concepts touched upon in later lessons. The distance travelled is found by calculating the area under a speed-time graph.
In order to calculate the distance travelled by the train therefore, we need to calculate the area under the graph that is drawn. To make things easier, we can separate this graph into shapes:
2 triangles and 1 rectangle
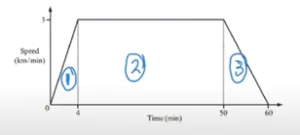
Triangle 1: Area of a triangle = ½ × base of triangle × height of triangle Area = ½ × 4 km × 3 km/min Area = 6 km2
Rectangle: Length of the rectangle can be found by finding out the difference between 50 and 4, which equals to 46 min. The height of the rectangle is 3 km/min. Area = length × base Area = 46 min × 3 km/min Area = 138 km
Triangle 2: Area of a triangle = ½ × base of triangle × height of triangle Area = ½ × 10 km × 3 km/min Area = 15 km
Total Area under the graph = Total distance travelled by the train Therefore, Total Distance = Triangle 1 + Rectangle + Triangle 2 Total Distance = 6 km + 138 km + 15 km Total Distance = 159 km
Those are the basic tips and tricks you would need to learn in this particular chapter!
Travel Graphs at Exams
Pay attention to what sort of graph is given to you. Is it a distance-time graph? A speed-time graph? Depending on the type of graph, remember, the value represented by the gradient changes, and so does the value represented by the area under the graph.
Practice as many questions as you can on this topic. They are quite simple once you get the hang of them. You can find some questions in this quiz to check where you stand!
If you are struggling with IGCSE revision or the Mathematics subject in particular, you can reach out to us at Tutopiya to join revision sessions or find yourself the right tutor for you.
Watch the video below for a visual explanation of the lesson on the ultimate guide to travel graphs!
Ready to Excel in Your Studies?
Get personalised help from Tutopiya's expert tutors. Whether it's IGCSE, IB, A-Levels, or any other curriculum — we match you with the perfect tutor and your first session is free.
Book Your Free TrialWritten by
Tutopiya Team
Educational Expert
Related Articles

IELTS Reading Band 6 Tips: Build Foundations
IELTS Reading band 6 tips — timing, question types and Cambridge IELTS reading practice targets.

IELTS Reading Band 6 to 7 Plan
IELTS Reading band 6 to 7 study plan — four-week Cambridge reading practice schedule.

IELTS Reading Band 8 Tips: Near-Perfect Practice
IELTS Reading band 8 tips — precision, speed and Cambridge IELTS reading practice for top scores.