
IGCSE Economics Notes 2026: FREE and Downloadable
Looking for IGCSE Economics notes 2022 to download and free notes and resources for IGCSE Economics?
You have come to the right place! This article will cover 2 main topics.
You can find the downloadable version at the end of this blog article!
The content tested for IGCSE economics are as follows:
1 The basic economic problem
- Fundamental ideas and concepts that underpin the study of economics
- Basic economic problems, factors of production, opportunity cost and production possibility curves.
2 The allocation of resources
- Fundamental principles of resource allocation
- Price mechanism
- Demand and Supply
- Market Equilibrium and disequilibrium
- Elasticity
3 Microeconomics decision-makers
- Major decision makers; banks, households, workers, trade union and firms
4 Government and the macroeconomy
5 Economic development
6 International trade and globalisation
- Importance of trade between countries
- The growth of globalisation
Topics covered in this article
- Basic Economics Problem
- Allocation of Resources
1 The Basic Economic Problem
Factors Of Production
1 Land
Land refers to all-natural resources which are free gifts of nature.
2. Labour
Human efforts done mentally or physically with the aim of earning an income is known as labour.
3. Capital
All man-made goods which are used for further production of wealth are included in capital.
4. Entrepreneur
An entrepreneur is a person who organises the other factors and undertakes the risks and uncertainties involved in the production.
Opportunity Cost
According to the dictionary, opportunity cost means the loss of other alternatives when one alternative is chosen.
In economics terms, it means the benefits an individual, investor or business misses out on when choosing one alternative over another.
The opportunity cost of a resource also refers to the value of the next-highest valued alternative use of that resource.
When economists use the word “cost,” they usually mean opportunity cost.
Some examples to help you better understand what opportunity cost means.
Example
Someone gives up going to see a movie to study for a test in order to get a good grade. The opportunity cost is the cost of the movie and the enjoyment of seeing it.
Tony buys a pizza and with that same amount of money he could have bought a drink and a hot dog. The opportunity cost is the drink and hot dog.
You decide to spend $80 on some great shoes and do not pay your electric bill. The opportunity cost is having the electricity turned off, having to pay an activation fee and late charges. You might also have food in the fridge that gets ruined that would add to the total cost.
Production Possibilities Curve
A production possibility curve measures the maximum output of two goods using a fixed amount of input. The input is any combination of the four factors of production.
Each point on the curve shows how much each good will be produced when resources shift from making more of one good and less of the other.
**The curve measures the trade-off between producing one good versus another.
Example
An economy can produce 20,000 oranges and 120,000 apples. On the graph, that is point B. If it wants to produce more oranges, it must produce fewer apples.
By describing this trade-off, the curve demonstrates the concept of opportunity cost.
Making more of one good will cost society the opportunity of making more of the other good.
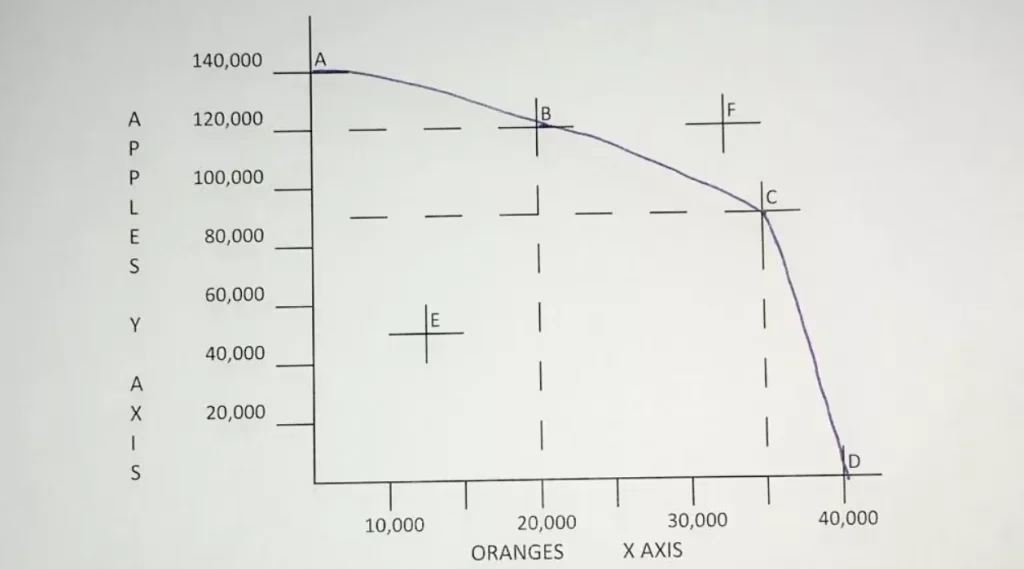
An economy that operates at the frontier has the highest standard of living, as it is producing as much as it can using the same resources.
If the amount produced is inside the curve, then all of the resources are not being used. On the graph, that would be point E.
One possible reason could be a recession or depression when there is not enough demand for either good.
Content Summary
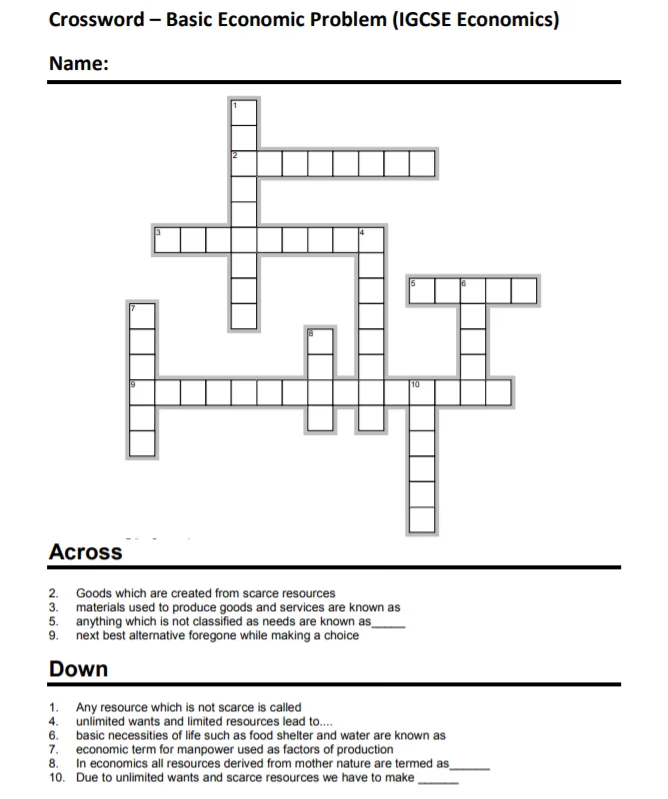
Try this quick crossword to check your understanding of the first topic of the IGCSE Economics.
2 The Allocation Of Resources
Price Mechanism
Price mechanism refers to the price system where the forces of demand and supply determine the prices of commodities and the changes therein.
It is also the outcome of the free play of market forces of demand and supply.
It is the buyers and sellers who actually determine the price of a commodity. However, sometimes the government controls the price mechanism to make commodities affordable for poor people too.
The price mechanism is a mechanism where price plays a key role in directing the activities of producers, consumers and resource suppliers.
Demand and Supply
What is the law of Supply and Demand?
It is a theory that explains the interaction between the sellers of resource and buyers for that resource.
It defines what effect the relationship between the availability of a particular product and the desire (or demand) for that product has on its price.
Several independent factors can affect the shape of market supply and demand. It would influence both the prices and quantities that we observe in markets.
Generally, LOW supply and HIGH demand increase price and vice versa.
Law of Demand
The law of demand says that at higher prices, buyers will demand less of an economic good.
Movement along Demand Curve
A change in price causes a movement along the demand curve.
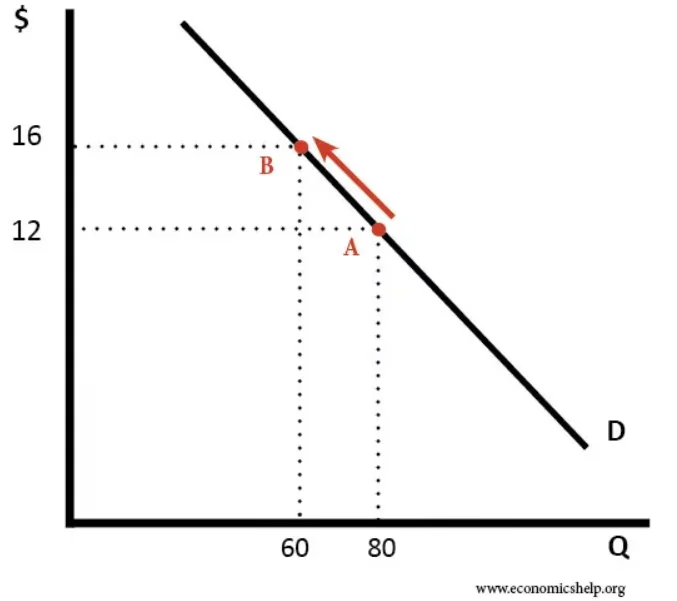
An increase in price from $12 to $16 causes a movement along the demand curve.
Quantity Demand falls from 80 to 60.
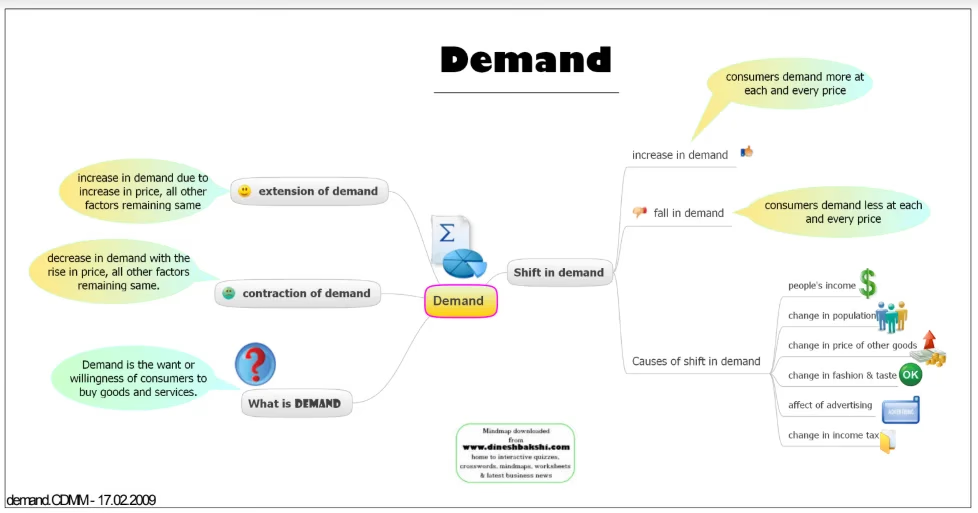
The shift in the Demand Curve
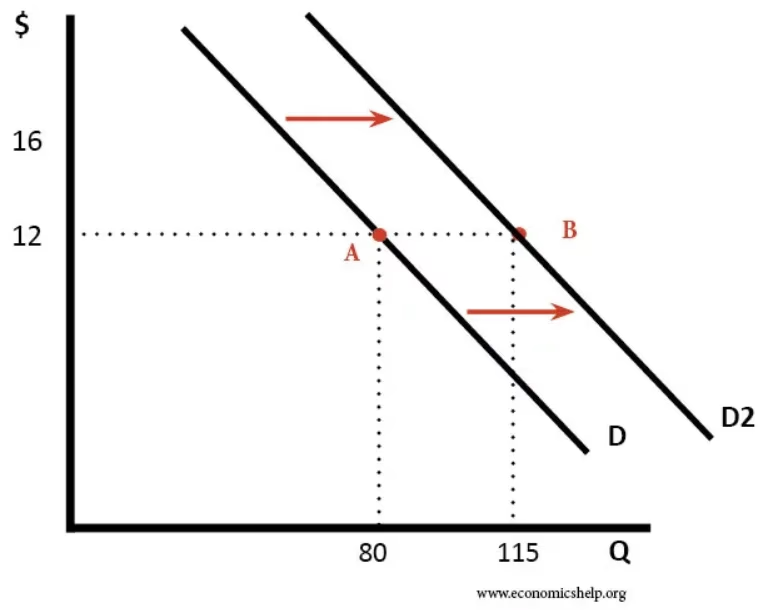
A shift in the demand curve occurs when the whole demand curve moves to the right or left.
For example, an increase in income would mean people can afford to buy more widgets even at the same price.
The demand curve could shift right for the following reasons:
- The good became more popular
- The price of a substitute good increases
- The price of a complement good decreased
- A rise in incomes
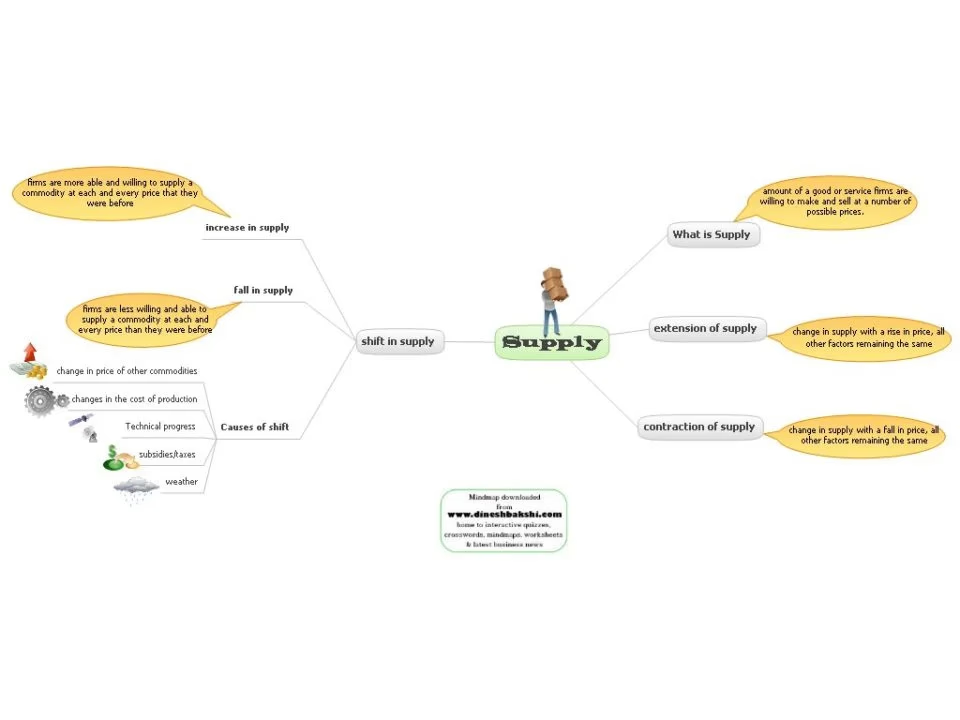
Law of Supply
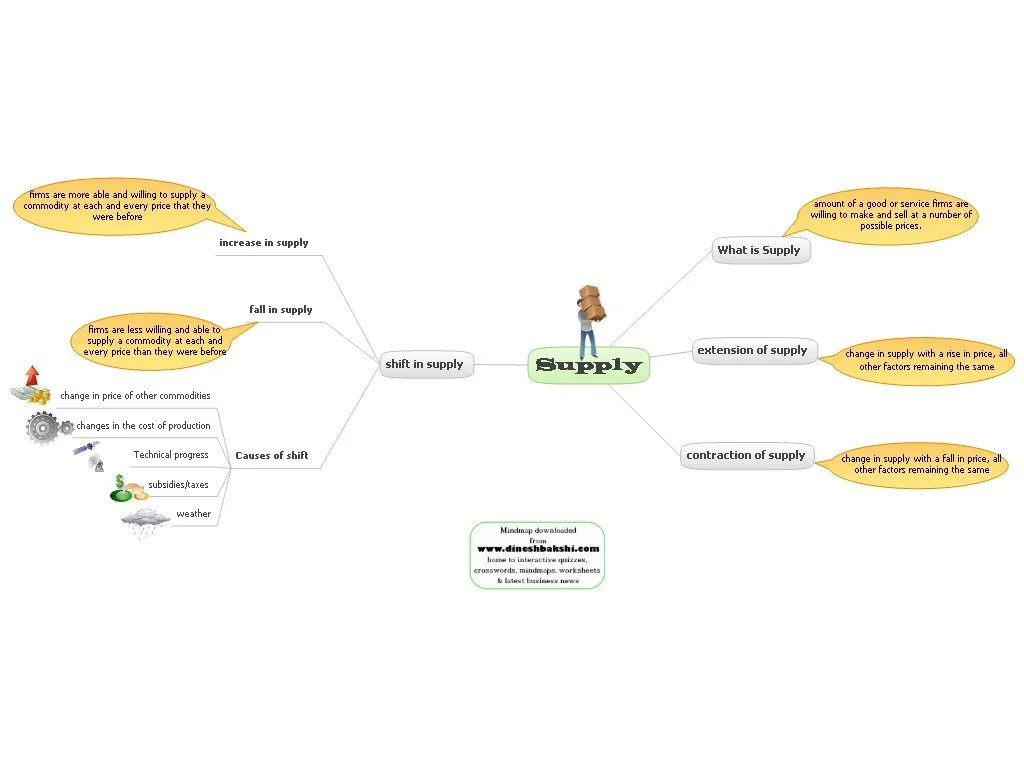
The law of supply says that at higher prices, sellers will supply more of an economic good. In other words, the law of supply states that as the price of an item increases, suppliers will attempt to maximise their profits by increasing the quantity offered for sale.
Supply in a market can be depicted as an upward sloping supply curve that shows how the quantity supplied will respond to various prices over a period of time.
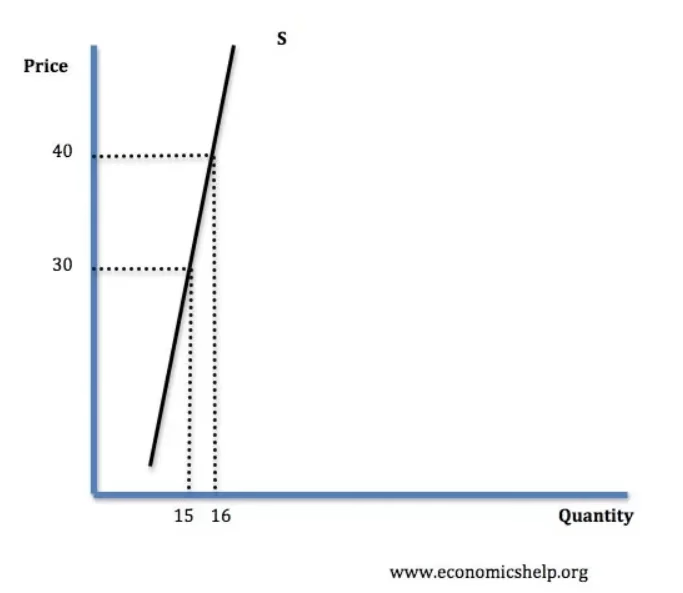
Movement along the supply curve
Shifts in the Supply curve
To the left
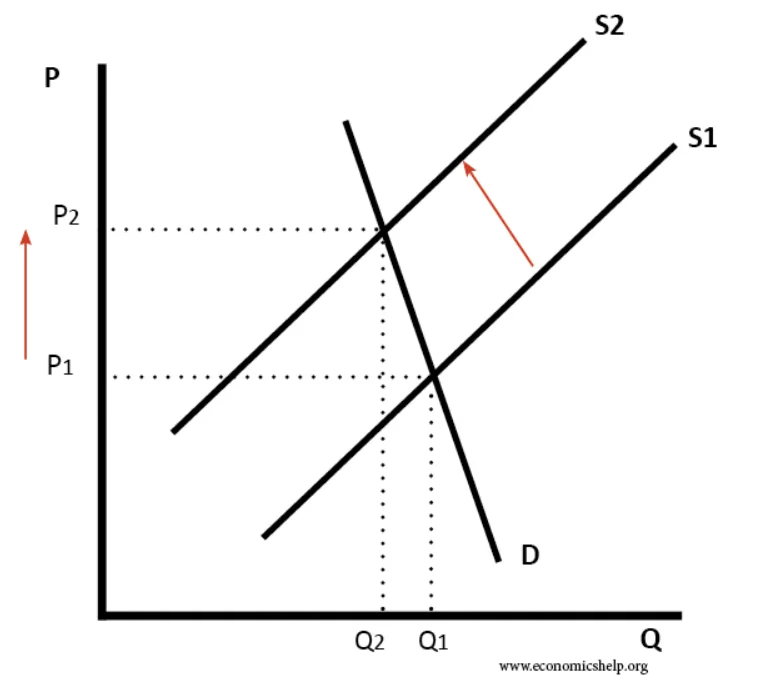
From this graph, we can tell there is a fall in supply if it shifts left. This also causes the price to be higher.
To the right
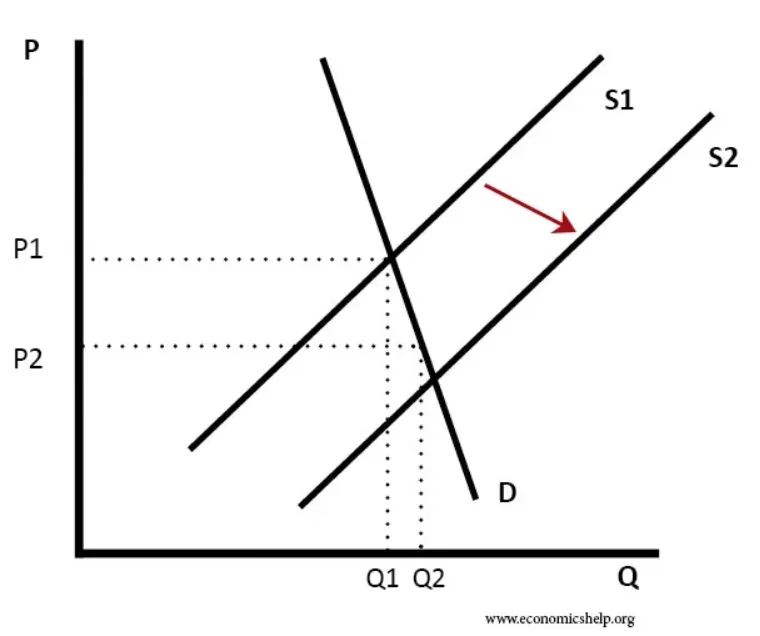
The graph shows an increase in supply and decrease in price. This could occur due to the following reasons:
- A decrease in the costs of production
- More firms
- Investment in capacity
- Related supply
- Weather
- Technological improvements
- Lower taxes
- Government subsidies
Market Equilibrium
Consumers and producers react differently to price changes. Higher prices tend to reduce demand while encouraging supply, and lower prices increase demand while discouraging supply.
Economic theory suggests that in a free market there will be a single price which brings demand and supply into balance, called equilibrium price.
Both parties require the scarce resource that the other has and hence there is a considerable incentive to engage in an exchange.
Example
| Price (p) | Quantity Supplied | Quantity demanded |
|---|---|---|
| 80 | 2000 | 0 |
| 70 | 1800 | 200 |
| 60 | 1600 | 400 |
| 50 | 1400 | 600 |
| 40 | 1200 | 800 |
| 30 | 1000 | 1000 |
| 20 | 80 | 1200 |
| 10 | 600 | 1400 |
| 0 | 400 | 1600 |
As can be seen, this market will be in equilibrium at the price of 30p per soft drink.
At this price, the demand for drinks by students equals the supply, and the market will clear.
There will be no excess demand or supply at 30p.
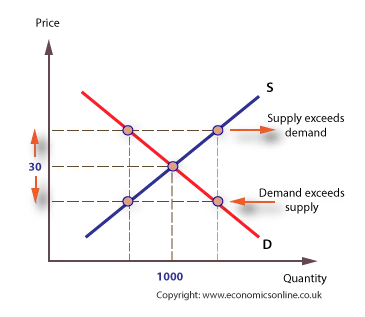
How is the equilibrium established?
At a price higher than equilibrium, demand will be less than 1000, but supply will be more than 1000 and there will be an excess of supply in the short run.
Graphically, we can say that demand contracts inwards along the curve. Whereas, the supply curve extends outwards along the curve.
Both of these changes are called movement along the demand or supply curve. This is in response to a price change.
Elasticity
Price Elasticity of Demand
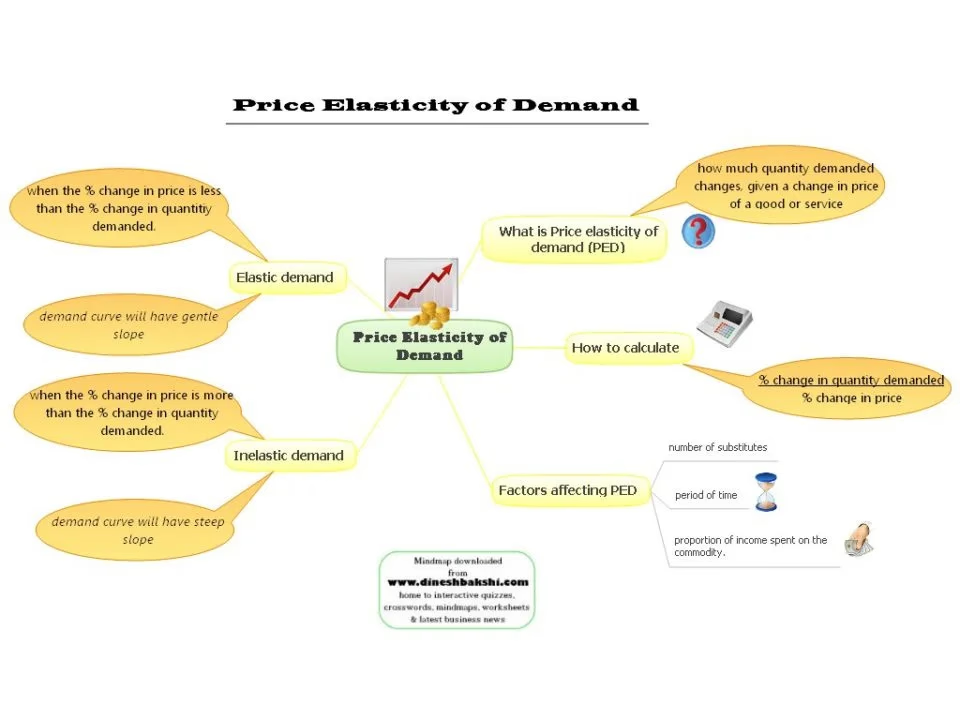
Price elasticity of demand refers to the measure of the change in the quantity demanded or purchased of a product in relation to its price change.
The more easily a shopper can substitute one product with a rising price for another, the more the price will fall - “be elastic”.
Example
If the price of coffee goes up, people will have no problem switching to tea. The demand for coffee will fall. This is because coffee and tea are considered good substitutes to each other.
Inelastic examples would include luxury items where shoppers “pay for the privilege” of buying a brand name, addictive products, and required add-on products.
Time also matters.
Demand response to price fluctuations is different for a one-day sale than for a price change over a season or year.
Price Elasticity of Supply
Price elasticity of supply measures the responsiveness to the supply of a good or service after a change in its market price.
According to basic economic theory, the supply of good increases when its price rises.
Formula
Price elasticity of supply = % Change in Supply / % Change in Price
There are different types of elasticity of supply
- Perfectly inelastic supply
- Relatively inelastic supply
- Unit elastic supply
- Relatively elastic supply
- Perfectly elastic supply
Perfectly Inelastic Supply
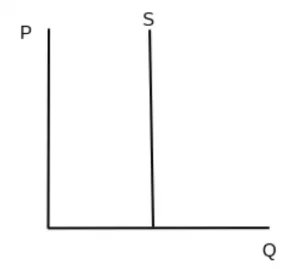
This happens is when the PES formula equals 0.
That is, there is no change in quantity supplied when the price changes.
Relatively Inelastic Supply
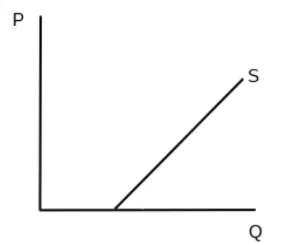
The PES for relatively inelastic supply is between 0 and 1.
That means the percentage change in quantity supplied changes by a lower percentage than the percentage of price change.
Unit Elastic Supply
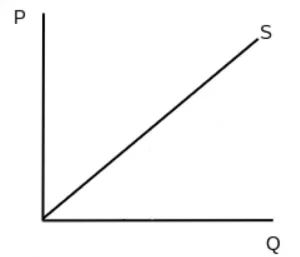
Unit Elastic Supply has a PES of 1.
The quantity supplied change by the same percentage as the price change.
Relatively Elastic Supply
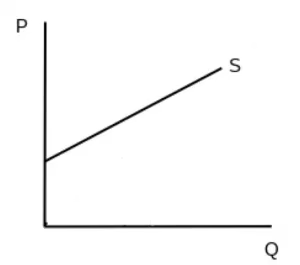
A price elasticity supply greater than 1 means supply is relatively elastic.
The quantity supplied changes by a larger percentage than the price change.
Perfectly Elastic Supply
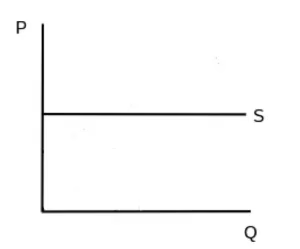
The PES for perfectly elastic supply is infinite.
The quantity supplied is unlimited at a given price, but no quantity can be supplied at any other price.
Content Summary
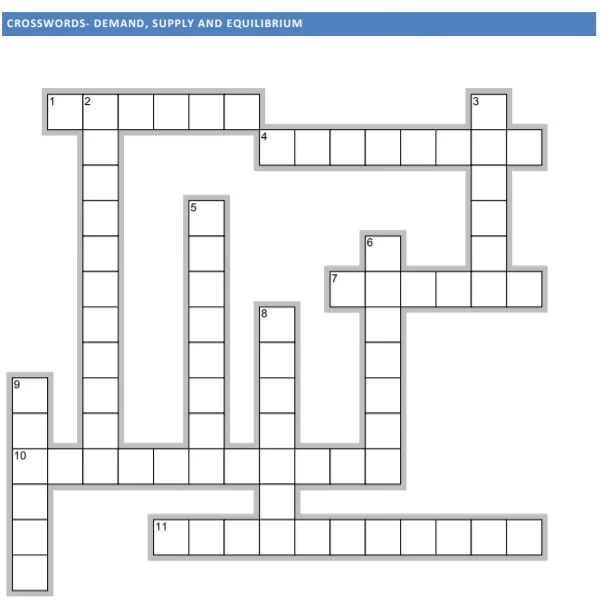
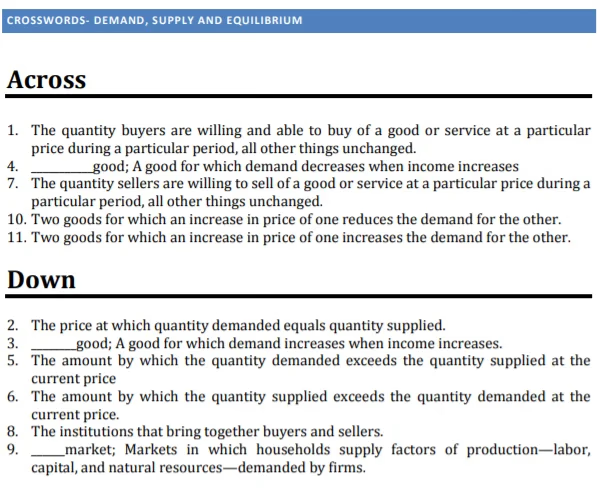
Check your understanding of Topics 2 of the IGCSE Economics by completing this crossword.
Download the resource here!

IGCSE Economics 2022
For more IGCSE Economics Notes 2022, visit the blog page. Read this blog article on IGCSE English Paper 3 here!
Tutopiya offers 1-1 Live Online Tutoring for IGCSE students aged 8 to 19. Our tutors are trained to teach online effectively.
There are other curriculums offered such as the IB, IGCSE and SAT. Visit our home page here.
There are many subjects offered here including IGCSE Economics. Bridging courses are also offered here.
Sign up for your FREE 1-hour trial today! Or you can fill up this trial form to redeem your FREE trial!
Approach any of our experts to arrange your online tuition. Experience online learning today!
Ready to Excel in Your Studies?
Get personalised help from Tutopiya's expert tutors. Whether it's IGCSE, IB, A-Levels, or any other curriculum — we match you with the perfect tutor and your first session is free.
Book Your Free TrialWritten by
Tutopiya Team
Educational Expert
Related Articles

Edexcel IGCSE Biology Past Papers 4BI1 Download
Edexcel IGCSE biology past papers for 4BI1 Higher tier — Paper 1 & 2 downloads, mark schemes, and revision workflow.
Edexcel IGCSE Biology Past Papers: Calculations
Calculation questions in Edexcel IGCSE biology past papers — magnification, percentage change, and means on 4BI1.

Edexcel IGCSE Biology Past Papers: Data & Graphs
Data and graph questions in Edexcel IGCSE biology past papers — trends, conclusions, and units on 4BI1.